Alerts
Define metric-based alert rules over traces and sessions, and get notified via webhook, email, Slack, or Zenduty when thresholds are breached.
Alerts
Alerts watch your project's metrics — latency, cost, token usage, error counts, and evaluation scores — and notify you when they cross a threshold. Each alert has a rule (what to watch) and one notification channel (where to send it).
How alerts work
- You define a rule: a metric, an aggregation, a comparison operator, a threshold, and a look-back window.
- The evaluator runs on a schedule, querying your project's traces or sessions over the window.
- If the aggregated value breaches the threshold, an alert event is created and the notification is dispatched.
- After firing, the rule enters a cooldown — it will not fire again for that duration even if the condition still holds.
- Events progress through three states: Firing → Acknowledged → Resolved.
Opening Alerts
Open Alerts under the Observability section of the left sidebar. The page has two tabs:
- Alert Events — every event the alert engine has produced, with current state and notification delivery status.
- Alert Rules — every rule you've configured. Toggle enabled, edit, or delete from here.
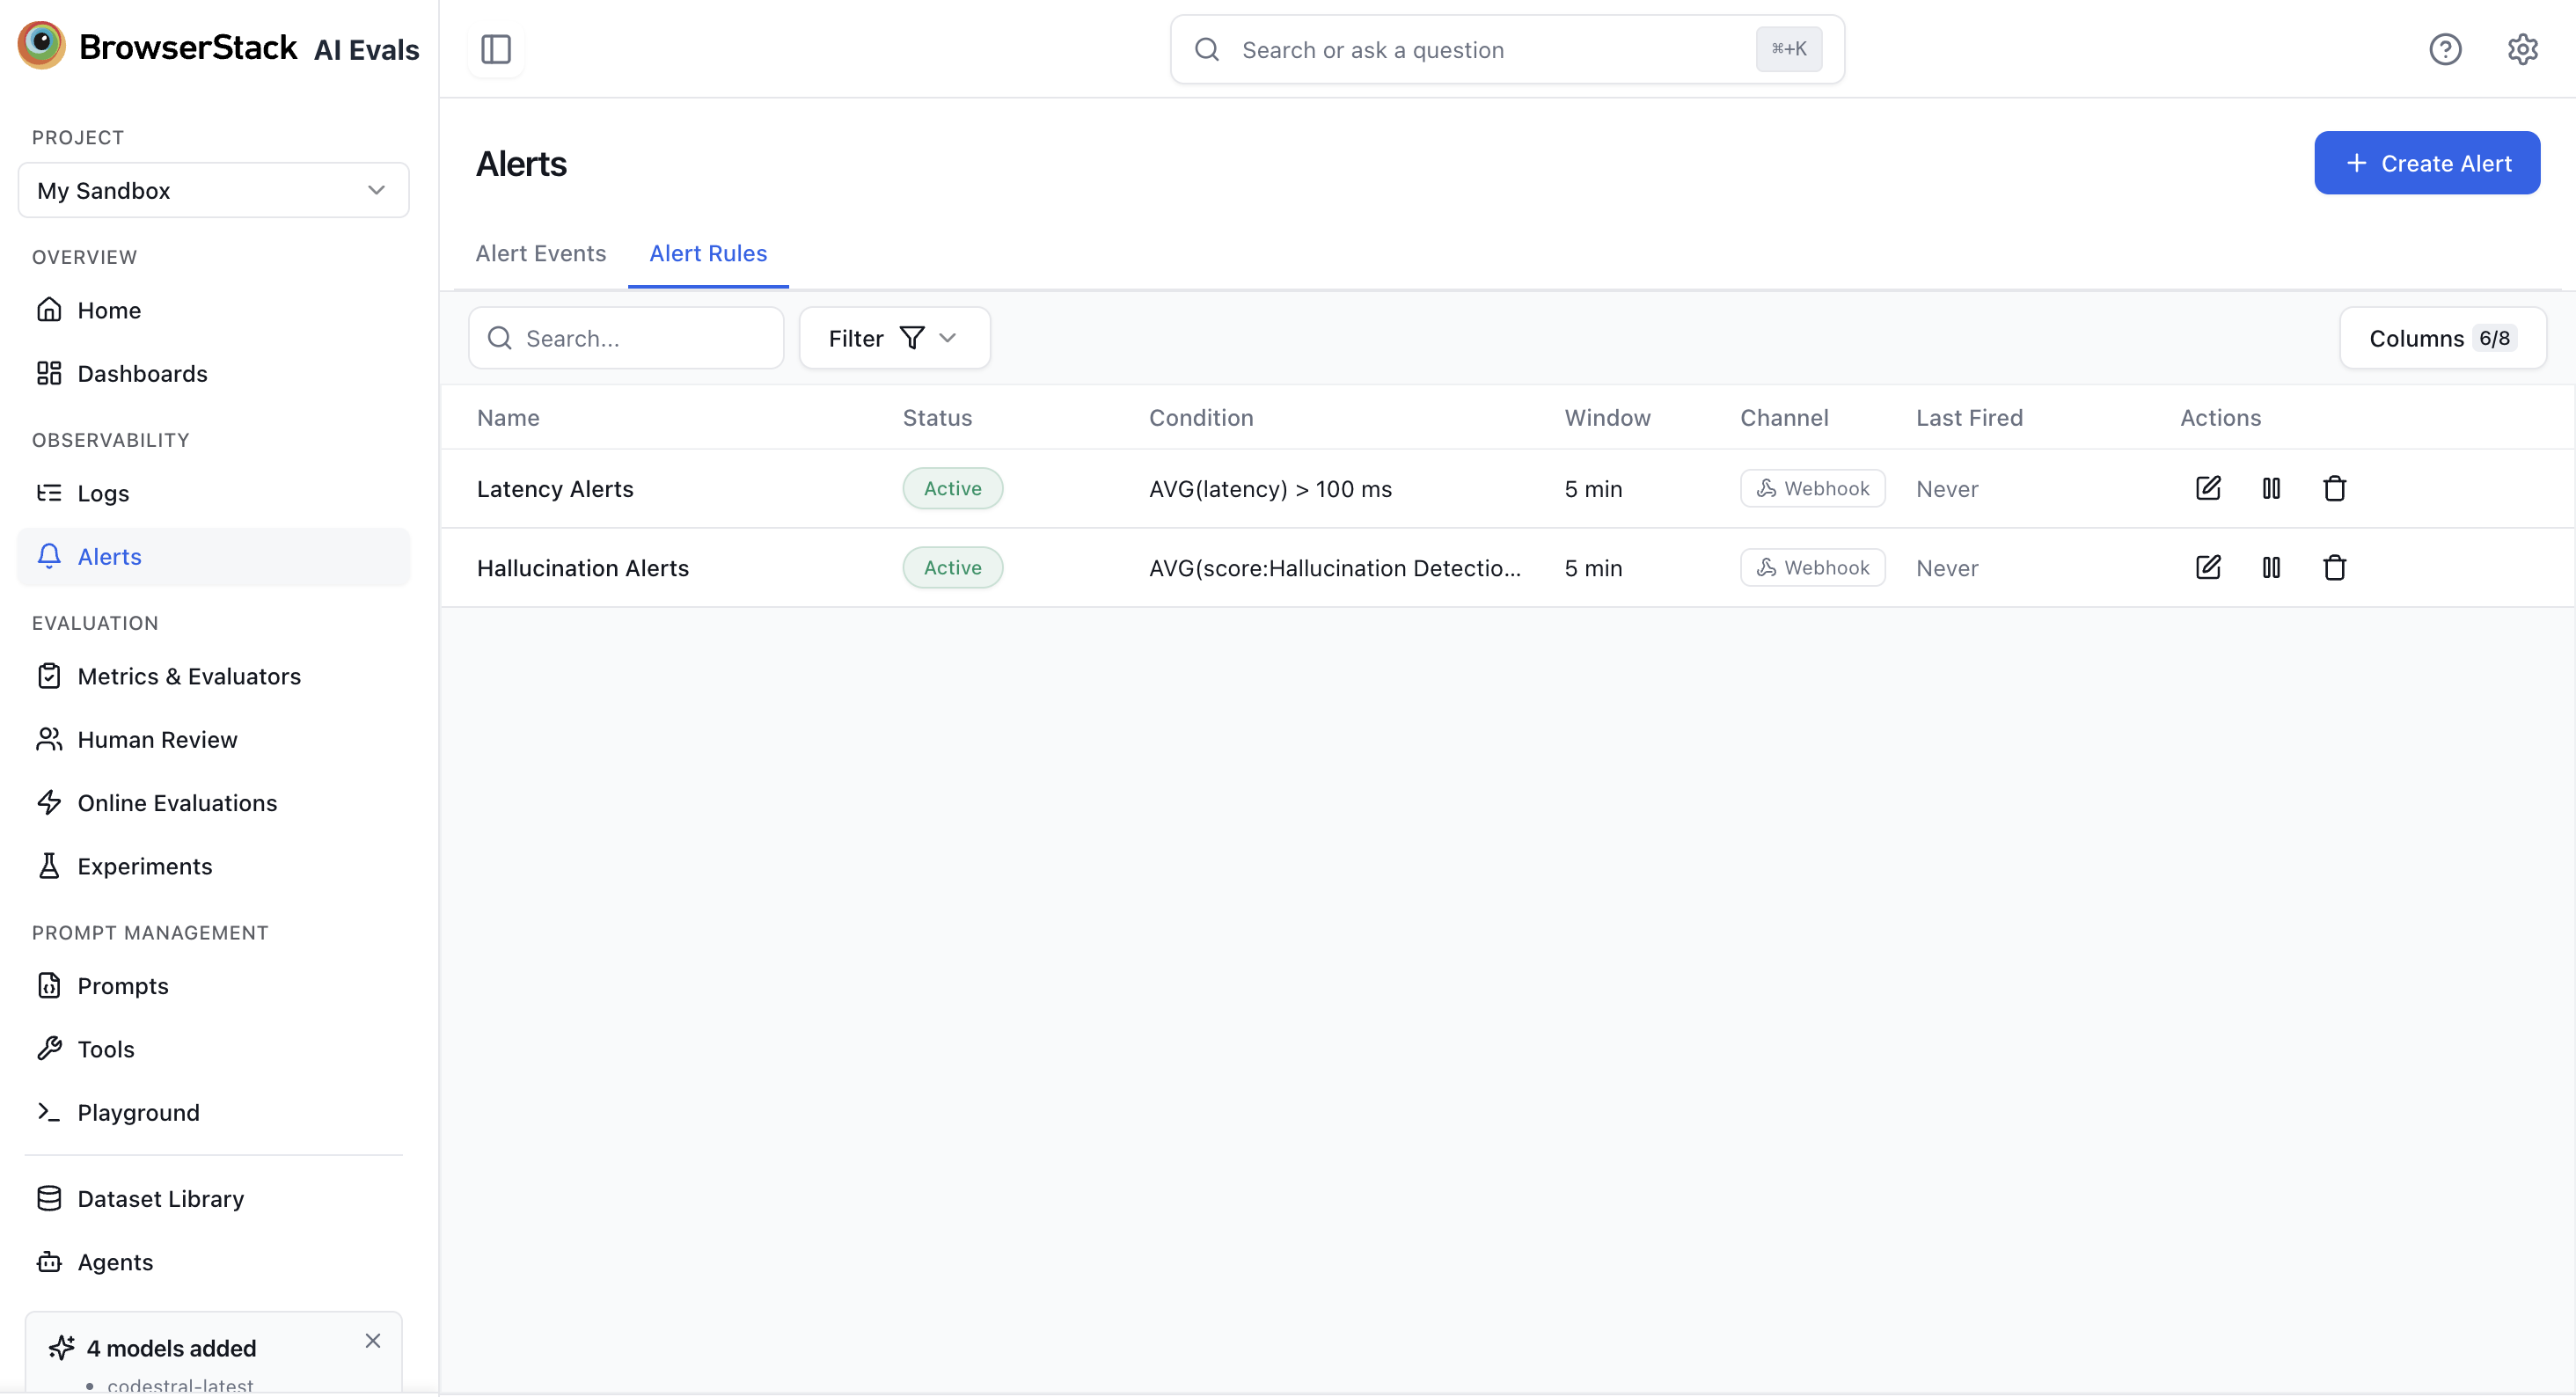
Click Create Alert at the top right to open the rule editor — it's a dropdown offering Metric Alert (described next) and Model Deprecation (see model deprecation alerts).
Create an alert
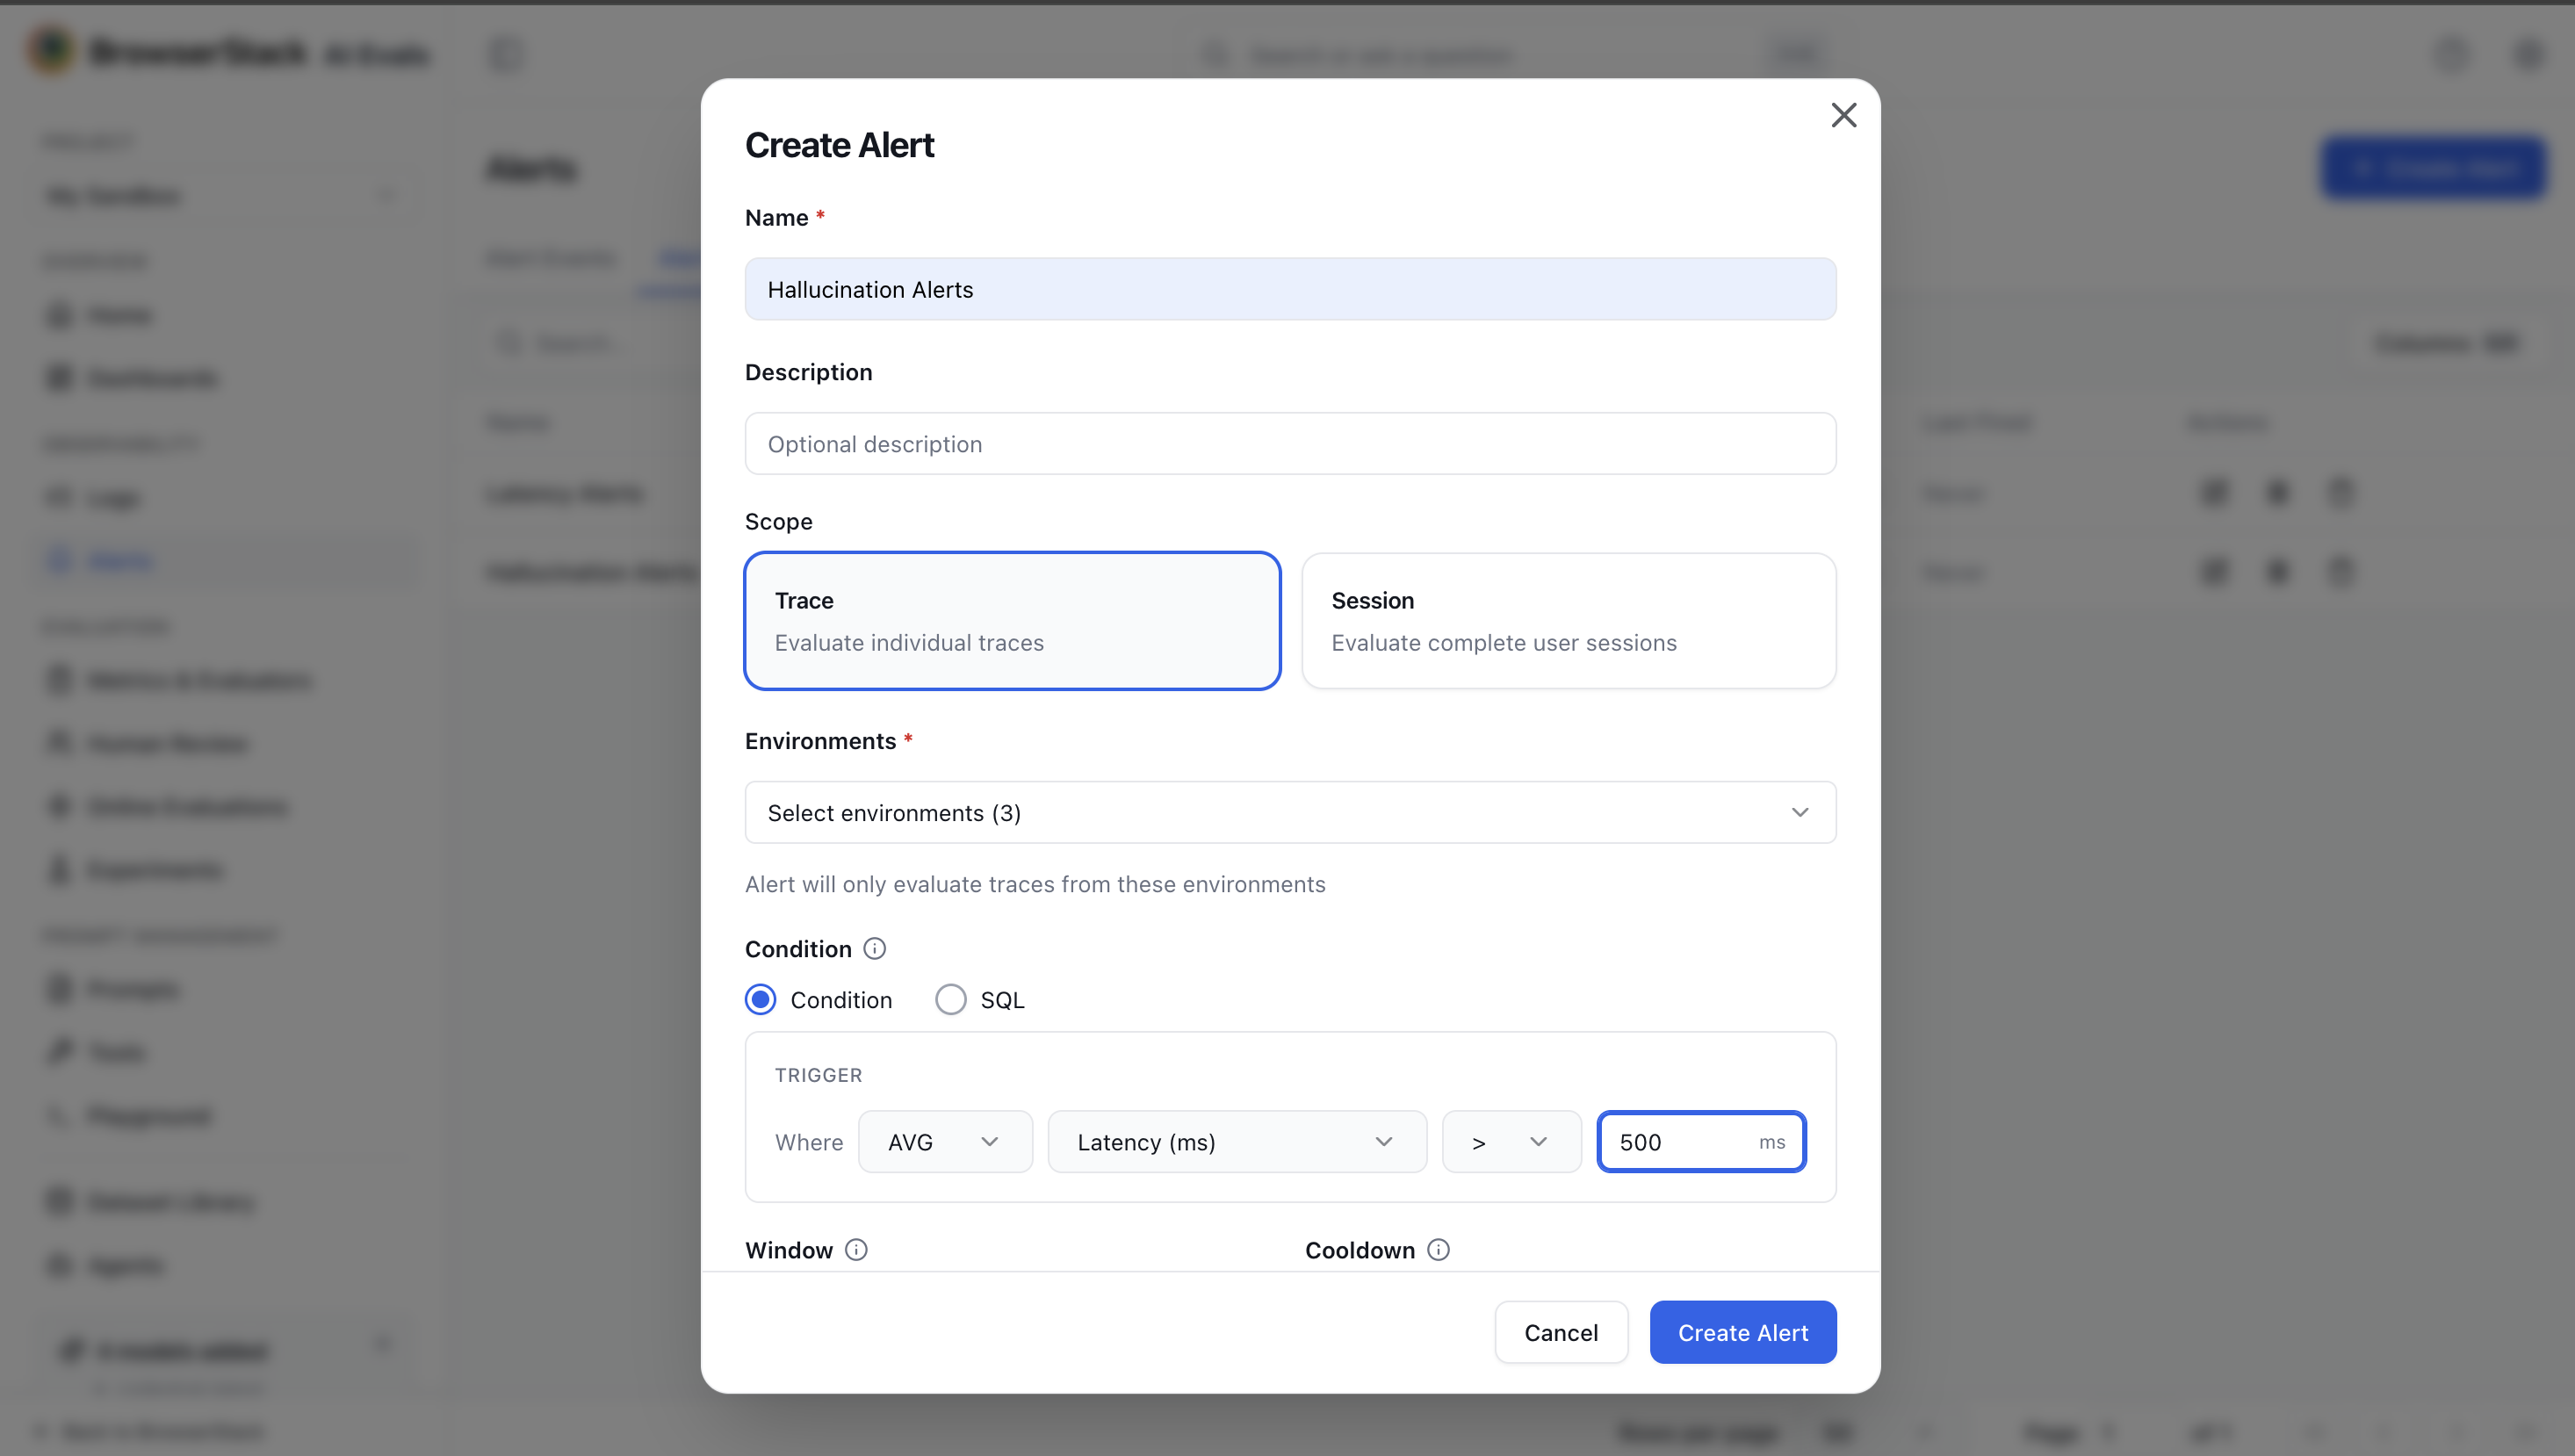
Name and description
- Name (required) — must be unique within the project. Example:
High latency on chat agent. - Description — optional free text to remind future-you why the rule exists.
Scope
Choose what each evaluation runs against:
- Trace — evaluate individual traces (one row per trace in the window).
- Session — evaluate complete user sessions (one row per session).
Switching scope clears the metric, threshold, and unit — those aren't comparable across scopes.
Environments
Pick one or more environments. The rule only evaluates traces from these environments — so you can run the same rule against production only, without noise from staging or development.
The Environments field is hidden when you pick a score-based metric. Online-evaluation scores are not environment-scoped.
Condition
The condition step has two modes, selected by the Condition / SQL toggle:
- Condition (default) — a guided builder you read as a sentence: Where Aggregation Metric Operator Threshold.
- SQL — write the condition as a custom SQL query, for cases the guided builder can't express.
Using the guided Condition builder:
| Field | Options |
|---|---|
| Aggregation | AVG, MIN, MAX, P50, P95, P99, SUM. Score metrics also support COUNT. |
| Metric | Latency (ms), Total Cost (USD), Prompt Tokens, Completion Tokens, Total Tokens, Error Count, plus any online-evaluation score in your project. |
| Operator | >, <, >=, <= |
| Threshold | Numeric value. Unit auto-fills from the metric (e.g. ms for latency, USD for cost). |
Example sentence: Where AVG Latency (ms) > 500.
Window and cooldown
- Window — the look-back period. Options:
5 min,10 min,15 min,30 min,1 hour,6 hours,12 hours,1 day,3 days,1 week. The alert is evaluated once per window interval. - Cooldown — after firing, the rule will not fire again for this duration. Options:
5 min,15 min,30 min,1 hour,6 hours. Prevents notification spam during a sustained breach.
Score-based alerts are capped at a 15 min window. If you change the window above 15 minutes while a score metric is selected, the metric resets and you'll need to pick a non-score metric.
Notification channel
Pick exactly one channel per rule:
- Webhook URL (required) — must be
http://orhttps://. Private and link-local addresses (localhost,127.0.0.0/8,10.0.0.0/8,192.168.0.0/16,172.16-31.0.0/12,169.254.0.0/16, IPv6 ULAfc00::/7,metadata.google.internal, hostnames ending in.localor.internal) are rejected. - Custom Headers — optional key/value pairs added to every webhook POST. Up to 10 headers per rule. Use this for
Authorizationtokens or routing keys. - Test Webhook — sends a sample payload to your URL using your configured headers, without creating a rule. Use this to verify connectivity and authentication before saving.
- Email Recipients — comma-separated list of email addresses. Each address receives a copy of every firing notification for this rule.
Post alerts straight to a Slack channel, then pick the target channel from the dropdown.
Slack must be connected for your organization first — do that in Settings → Integrations, where an admin authorizes the BrowserStack Slack app. Once connected, the Slack channel option appears here and lists your workspace's channels.
Deliver alerts to your own Zenduty account as incidents, via a Zenduty Generic Integration.
- Zenduty webhook URL (required) — your Zenduty Generic Integration URL, e.g.
https://events.zenduty.com/integration/…/generic/…/. Onlyzenduty.comand*.zenduty.comhosts are accepted. The field is masked — the URL embeds your integration key, so treat it as a credential. - Send as — the Zenduty alert type this rule raises on every fire: Critical (default), Error, Warning, or Info. It is fixed per rule; your own Zenduty alert rules decide the final priority and escalation from there.
- Send test alert — posts a one-off test payload (message "TestAI Evals test alert") to your URL without saving the rule, so you can confirm the integration before relying on it. Repeat tests reuse a fixed
entity_id, so they collapse into a single throwaway Zenduty incident.
To get the URL: in Zenduty, add a Team, then add a Service under it, then open Integrations → Add Incoming Integration → Generic Integration and paste the generated URL here.
Save
Click Create Alert. The rule is active immediately — the next scheduled evaluation will include it. You'll see a confirmation toast: "Alert created. Your alert rule is now active."
Metrics reference
System metrics work on both Trace and Session scopes:
| Metric | Unit | Description |
|---|---|---|
| Latency | ms | End-to-end duration of the trace or session |
| Total Cost | USD | Sum of generation costs |
| Prompt Tokens | tokens | Input tokens consumed |
| Completion Tokens | tokens | Output tokens produced |
| Total Tokens | tokens | Sum of prompt + completion |
| Error Count | count | Number of failed observations |
Score metrics appear as score:<score-name> and are populated from your Online Evaluations. Only scores produced by online evaluation (source = EVAL, environment = online_evaluation) are available — manual annotation scores and experiment scores do not feed alert rules.
Notification channels
Webhook payload
When an alert fires, the notification worker POSTs this JSON body to your webhook URL:
{
  "alertId": "cuid-of-the-rule",
  "alertName": "High latency on chat agent",
  "projectId": "your-project-id",
  "state": "FIRING",
  "message": "AVG latency exceeded 500 ms (actual: 742.31 ms) over the last 5 min",
  "condition": {
    "metric": "latency",
    "aggregation": "AVG",
    "operator": "GT",
    "threshold": 500,
    "scope": "TRACE",
    "windowMinutes": 5
  },
  "evaluation": {
    "metricValue": 742.31,
    "breached": true
  },
  "firedAt": "2026-05-11T14:00:00.000Z"
}
Delivery semantics:
- Method:
POST Content-Type: application/json- Your Custom Headers are merged into the request headers (your
Content-Typewill be overridden if you set one). - Timeout: 10 seconds.
- Retries: up to 3 attempts with exponential backoff (handled by the queue).
4xxresponses (except429) are treated as permanent failures and skipped to the dead-letter queue immediately — fix your endpoint and resave the rule rather than waiting for a retry.
Email recipients receive a formatted message containing the alert name, the breached condition, the actual metric value, and the time it fired. Email delivery uses the same retry policy as webhooks.
Slack
When an alert fires, a formatted message is posted to the Slack channel selected on the rule. Connect Slack once for your organization in Settings → Integrations (an admin authorizes the BrowserStack Slack app); after that, the Slack channel option lists your workspace's channels when you create or edit an alert.
Zenduty
When a metric alert fires, the notification worker POSTs a Zenduty Generic Integration payload to your configured URL:
{
  "alert_type": "critical",
  "message": "High latency on chat agent",
  "summary": "AVG latency exceeded 500 ms (actual: 742.31 ms) over the last 5 min\nCondition: AVG latency > 500 ms.\nValue: 742.31.\nhttps://<your-instance>/project/<project-id>/alerts?ref=alert_zenduty",
  "entity_id": "cuid-of-the-rule"
}
Delivery semantics:
- For a metric breach,
messageis the alert rule's name andentity_idis fixed to the rule's ID — repeated fires of the same rule collapse into one Zenduty incident instead of opening a new one each time.summarycarries the breach message, the condition, the measured value, and a link back to the Alerts page. - For a model deprecation alert,
messageisModel deprecation — <model name>andentity_idcombines the rule and the model, so all reminder tiers for one model group into a single incident.summarynames the deprecation date, where the model is used, and the suggested replacement when the provider announced one. alert_typeis whatever you picked in Send as on the rule — it does not vary per fire.- Zenduty is send-only: AI Evals never reads back incident state, priority, or acknowledgements from Zenduty.
- Delivery uses the same notification queue and retry policy as webhooks, and is isolated per channel — for metric alerts, a Zenduty failure shows up in the event's
notificationResultswithout affecting anything else.
Alert events
The Alert Events tab shows every event the engine has produced. Each event has a state:
| State | Meaning |
|---|---|
FIRING | Condition is currently breached. Initial state when an event is created. |
ACKNOWLEDGED | A team member has acknowledged the event. The rule continues to evaluate; if it still breaches after the next window, a new event is created. |
RESOLVED | Marked as no longer requiring attention. Typically you resolve once the underlying issue is fixed. |
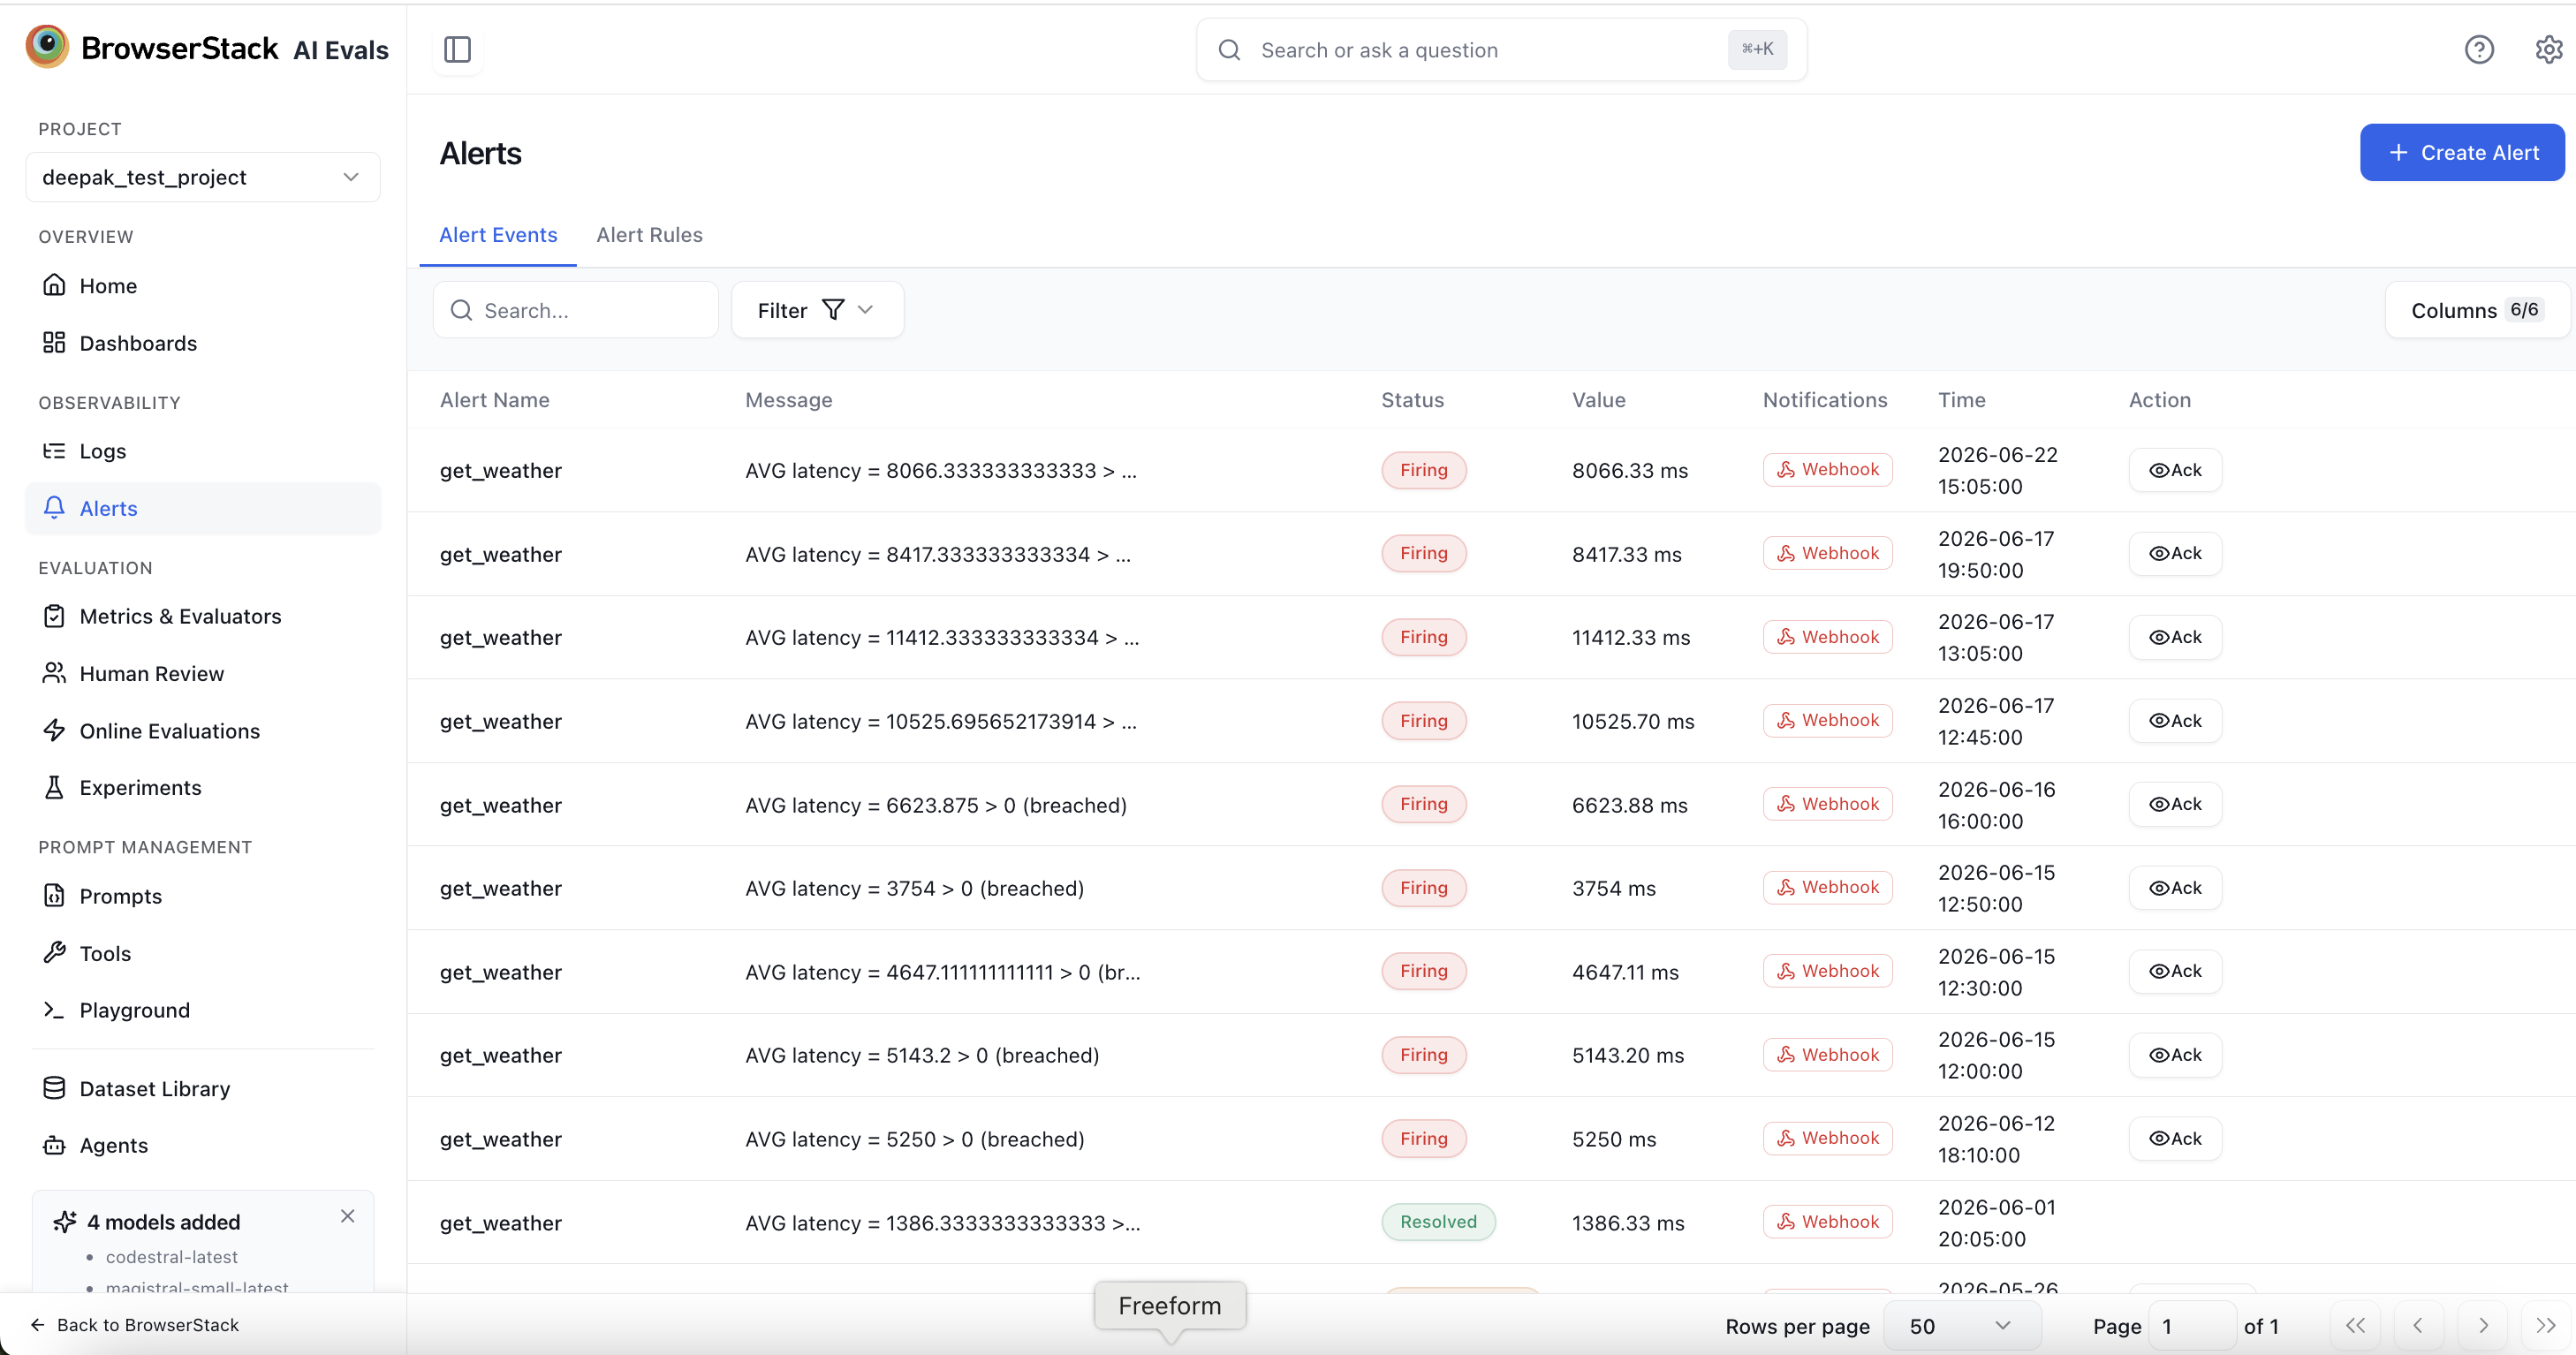
Each event also records notificationResults — a per-channel delivery log: { channel, status, error? }. This is how you debug a notification that didn't arrive.
Model deprecation alerts
A model deprecation alert watches your project for continued use of a model its provider has scheduled for retirement, and reminds you before it stops working. Unlike a metric alert, it has no threshold or SQL condition — it watches for usage, not a metric value.
How it works
- Deprecation lifecycle dates — the announced deprecation date, the hard-shutdown date, and a suggested replacement model where the provider names one — are tracked for models from OpenAI, Anthropic, Google (Gemini), Groq, and Mistral. See Model Deprecation on the Models settings page for how this status also appears in the model picker.
- A daily scan checks every deprecated model against four usage surfaces in your project: traces (LLM generations from the last 90 days), evaluators, prompts, and experiments. All four are always monitored — this isn't configurable in this release.
- If usage is found, reminders fire on an escalating schedule: 30, 7, and 1 day(s) before the deprecation date, plus one final notice on the hard-shutdown date (when the provider's API stops serving the model).
- Reminders are bucketed so exactly one tier is active at a time: an alert created when a model is already, say, 5 days from deprecation fires its current tier (the 7-day reminder), never a stale 30-day one. The notification names the tier and the real days remaining, and each reminder for a given alert, model, and tier fires at most once — rescans and retries never send duplicates.
- Each fired reminder also creates an entry in the Alert Events tab, with the same per-channel delivery log as metric alerts.
Create a model deprecation alert
Open the create menu
Click the Create Alert dropdown and choose Model Deprecation (Metric Alert opens the form described above).
Name the alert
Give the alert a Name — required, and unique across all alerts in the project (you'll see "An alert with this name already exists" on a clash). The form also shows a notice summarizing what's monitored: all usage surfaces, with reminders 30, 7, 1 days before deprecation.
Pick a notification channel
The same Notification Channel picker as a metric alert — Webhook, Email, Slack, or Zenduty — limited to one channel per alert. Fill the channel in: an alert whose channel is left empty delivers nothing, and because creating any deprecation alert takes over from the baseline email, an unconfigured alert means no notifications at all. For webhooks, use Test Webhook to confirm delivery before saving.
Save the alert
Click Create Alert. The alert is active immediately; the daily scan picks it up on its next run. Use the Enabled toggle when editing, or the pause action in the Alert Rules table, to disable it without deleting it.
Model deprecation alerts appear in the same Alert Rules table as metric alerts, tagged Model deprecation in the Alert type column (metric alerts are tagged Metric), with a condition summary like Model deprecation · all surfaces · reminders 30, 7, 1d before.
If you don't configure an alert
Projects are still covered by a baseline: if the daily scan finds usage of a deprecated model and the project has no active model deprecation alert, AI Evals emails the project owner directly (not the would-be alert creator) on the same 30/7/1-day schedule. Creating your own model deprecation alert takes over from this baseline — you won't get both for the same model and reminder tier — so make sure the alert's channel is actually filled in.
Programmatic access
Everything on this page is also available via SDK and REST — useful when you want to provision alerts as code, script bulk edits, or pause an alert from a deployment pipeline.
- SDK reference — typed
client.alert.{create,list,get,update,pause,resume,delete}methods in TypeScript, Python, and Java.
Permissions
Alerts follow your project role. Metric alerts and model deprecation alerts share the same permissions — there is no separate permission for either.
| Action | Who can do it |
|---|---|
| View alert rules and alert events | Owner, Admin, Member, Viewer |
| Create, edit, pause, or delete alerts (both types) | Owner, Admin, Member |
| Acknowledge or resolve alert events | Owner, Admin, Member |
Limits
| Limit | Value |
|---|---|
| Notification channels per rule | 1 (webhook, email, Slack, or Zenduty) |
| Custom headers per webhook | 10 |
| Webhook timeout | 10 seconds |
| Webhook retry attempts | 3 (exponential backoff) |
| Score-metric window cap | 15 minutes |
| Webhook URL — private/internal/link-local | Blocked at save time |
Zenduty URL — non-zenduty.com host | Blocked at save time |
| Model deprecation reminder tiers | 30, 7, and 1 day(s) before deprecation + hard-shutdown day, fixed in this release |
| Model deprecation usage surfaces | Traces, evaluators, prompts, experiments — all monitored, fixed in this release |
| Model deprecation channels per rule | 1 (fill it in — an empty channel delivers nothing) |
Use cases
- Cost guardrails —
AVG total_cost > 0.05on a 1-hour window catches a runaway pipeline cheaper than discovering it in next month's bill. - Latency regression detection —
P95 latency > 2000 mson a 15-minute window overproductiononly. - Hallucination spike —
AVG score:faithfulness < 0.6on a 15-minute window, paired with an online evaluation that scores faithfulness. - Error surge —
SUM error_count > 10on a 5-minute window — fastest signal that something is misconfigured downstream. - Model deprecation reminders — get notified 30/7/1 day(s) before a provider retires a model your traces, evaluators, prompts, or experiments still reference.
- On-call paging — route a production-only latency or error rule to Zenduty so a sustained breach opens an incident and pages whoever is on call.