Sessions
Viewing sessions in BrowserStack AI Evals — grouping traces into conversations, session metrics, and session detail.
Sessions
Sessions group related traces together under a shared identifier. This is most useful for multi-turn conversations where each user message produces a separate trace but they all belong to the same chat session.
What Is a Session
A session is created automatically when your SDK sends a trace with a session_id field set. All traces sharing the same session_id are grouped into one session in the dashboard.
Sessions are useful for:
- Viewing the full turn-by-turn history of a conversation
- Computing session-level metrics (total cost, total tokens, total duration)
- Evaluating conversational quality across multiple turns
Sessions List
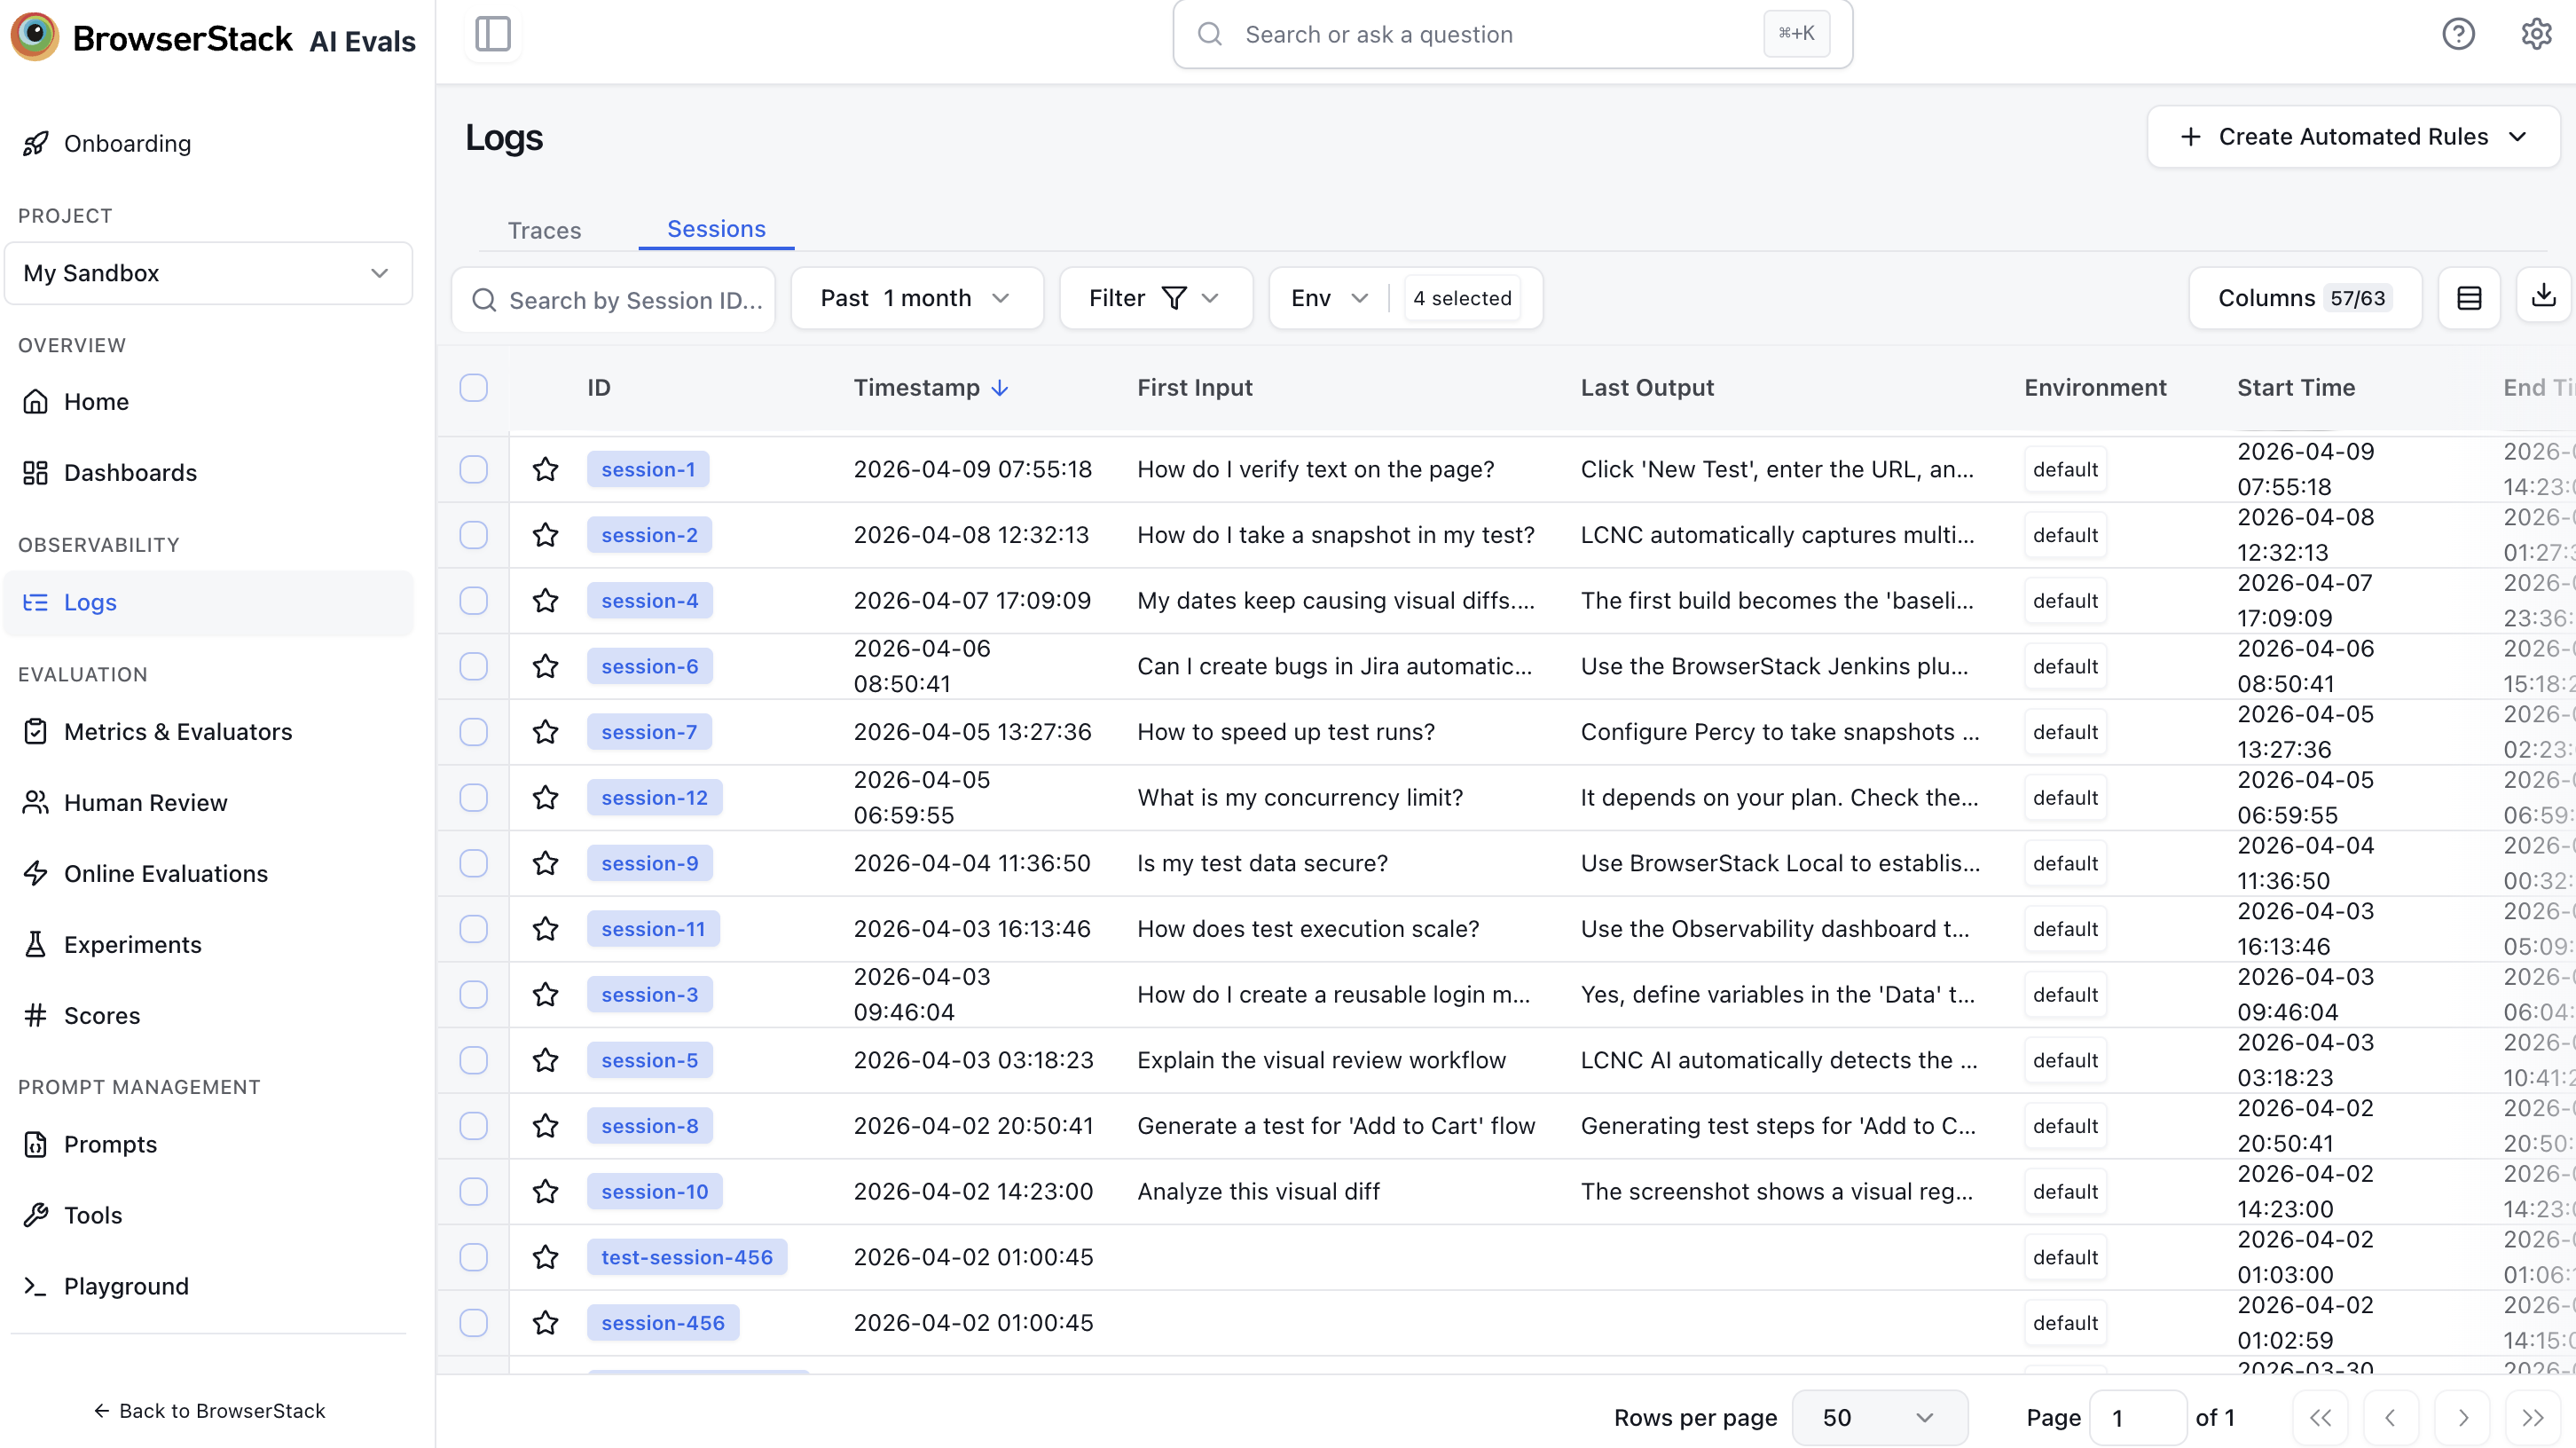
Navigate to Logs → Select 'Sessions' Tab in the left sidebar.
The sessions list shows one row per session. Each row displays:
| Column | Description |
|---|---|
| Session ID | The session identifier from your application |
| Timestamp | When the session was created |
| First Input | Preview of the first user message |
| Last Output | Preview of the most recent AI response |
| Last Active | Timestamp of the most recent trace |
| Traces | Number of traces in the session |
| Observations | Total observation count |
| Total Duration | Time from first trace to last trace |
| Total Cost | Sum of costs across all traces |
| Total Tokens | Sum of tokens across all traces |
| Total Latency | Sum of latency across all traces |
| Environment | Environment tag |
Additional columns (hidden by default): Version, Release, Trace Tags, Level. Use the column visibility toggle to show/hide columns.
Click any row to open the session detail view.
Session Detail
The session detail view uses a split-screen interface:
- Left pane (The Narrative): A chat interface showing User (right) and AI (left) bubbles. Each message pair displays its specific cost and latency.
- Right pane (Trace Inspector): The technical trace tree for the selected message pair. Clicking a message in the chat highlights its corresponding execution trace.
The top of the page shows session-level summary metrics: total traces, total tokens, total cost, and session duration.
The chat view shows each turn in the conversation in chronological order. Click any message pair to inspect its trace in the right pane.
Click any trace in the right pane to open the full trace detail view. You can navigate between traces in the session using the Previous/Next buttons.
Use the ← Back to Sessions link to return to the sessions list.
Session-Level Evaluation
Sessions can be scored using Online Evaluations. When creating an online evaluation rule, select Session as the event type to evaluate at the session level rather than individual traces.
Session-level evaluation is useful when you need to measure:
- Whether the AI successfully completed a multi-turn task
- Conversation coherence and context retention across turns
- State drift or memory issues in long conversations
Scores from session evaluations appear in the session detail view under the Scores section.
Actions
Add to Human Review
Route an entire session to a Human Review queue. Reviewers see the Conversation View by default, allowing them to score the narrative flow rather than raw logs.
Add to Dataset
Capture multi-turn data for fine-tuning or testing:
- Full Session: Export the entire message history and expected tool calls as a dataset item.
Setting a Session ID in the SDK
To associate traces with a session, pass a sessionId when creating each trace:
const trace = testOps.trace({
  name: 'chat-turn',
  sessionId: 'conv-user-123-session-456',
  input: { message: userMessage },
});
trace = test_ops.trace(
name="chat-turn",
session_id="conv-user-123-session-456",
input={"message": user_message},
)Trace trace = traceManager.trace(TraceBody.builder()
.name("chat-turn")
.sessionId("conv-user-123-session-456")
.input(userMessage)
.build());All traces with the same session_id are automatically grouped into one session in the dashboard.